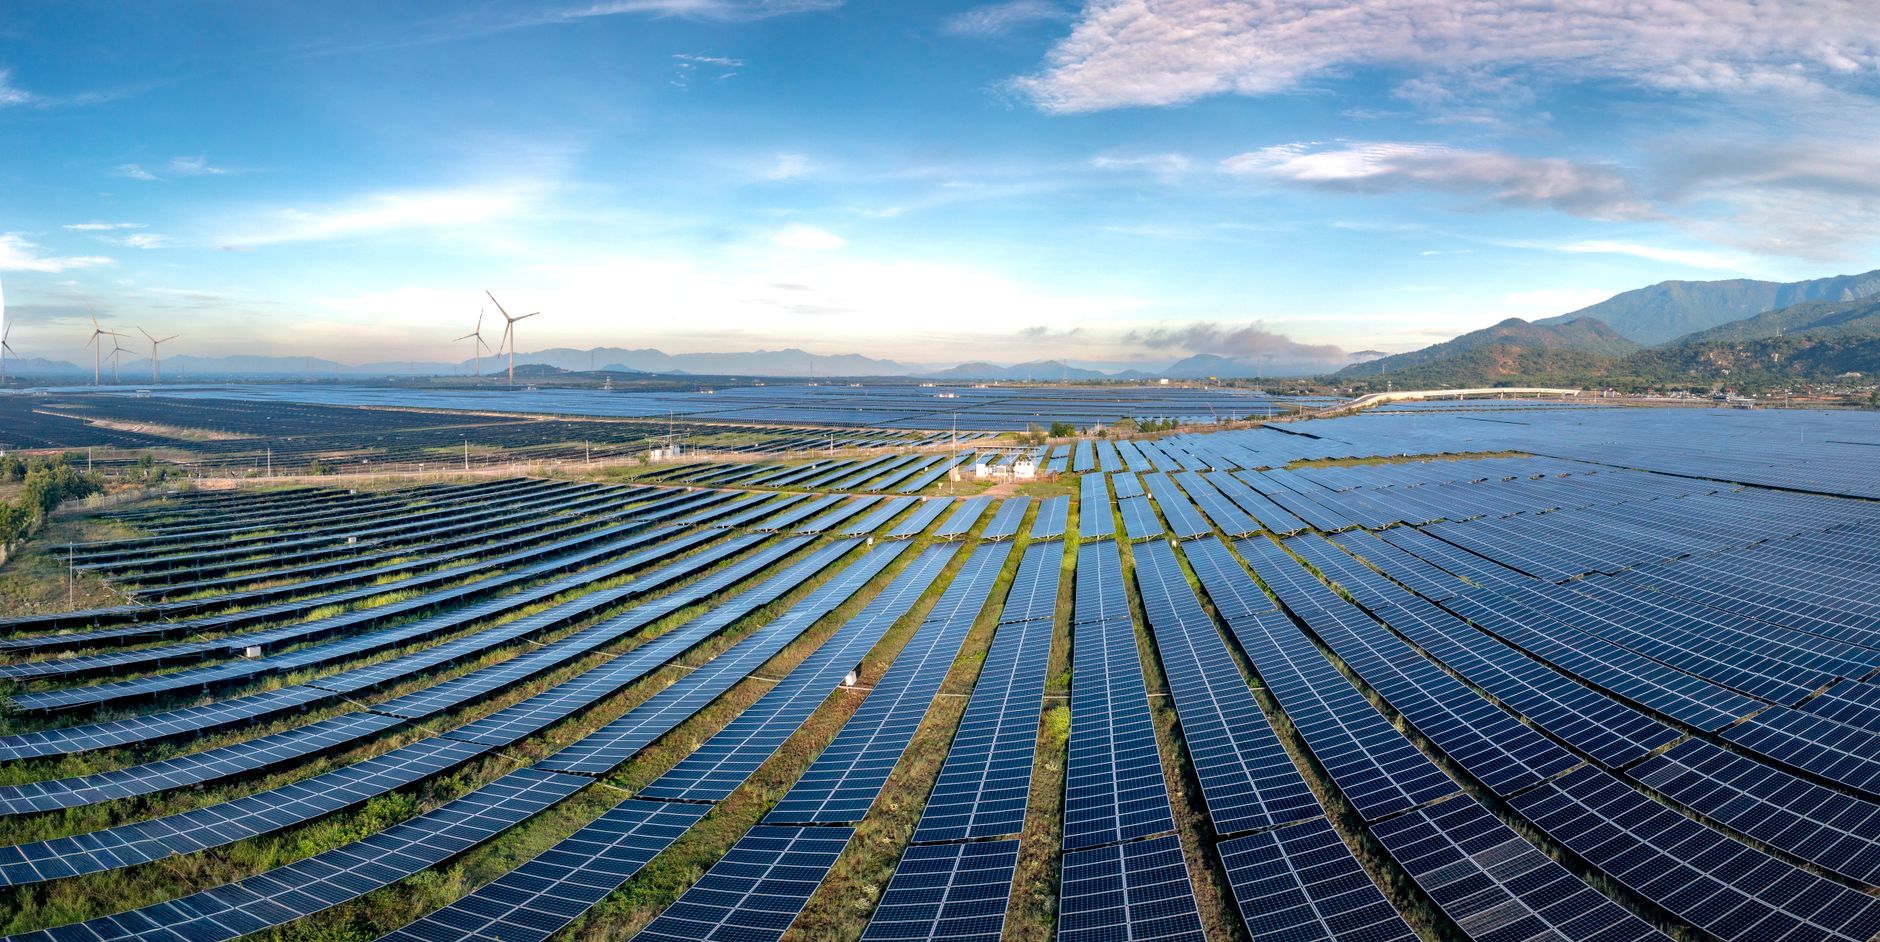
In the first quarter of 2026, wind turbines and solar panels generated more electricity than either coal plants or nuclear reactors produced individually, for the first time in U.S. history. Wind and solar combined generated 226,088 gigawatt-hours while nuclear produced 197,731 GWh and coal managed 172,493 GWh. The numbers come from the U.S. Energy Information Administration's May 2026 Electric Power Monthly, which tracks actual grid generation through March 31, 2026. This is not a projection, a goal, or a policy statement. This is what the grid actually did.
The milestone arrived faster than the baseline models suggested it would, driven by two forces: renewables accelerating and incumbents decelerating simultaneously. Utility-scale solar output jumped 23.9% year-over-year, hydropower rose 21.9%, and small-scale distributed solar grew 11.9%. Wind's growth was more modest at 2.1%, but the installed base is so large that even modest percentage gains move the needle in absolute terms. Coal, by contrast, fell 11.4% in a single quarter. Natural gas was essentially flat, up 1.1%, and nuclear barely moved at 0.9%. The EIA data shows renewables as a category grew 11.1% year-over-year, capturing nearly 29% of total U.S. generation.
What makes this inflection real is that wind and solar achieved it at substantially lower capacity factors than the plants they are outproducing. Coal operates at 48.7% capacity factor, meaning the typical coal plant runs at roughly half its theoretical maximum output. Nuclear is far higher at 91.0%, the fleet is nearly always on. Wind and solar, by contrast, operate at 34.2% and 24.4% capacity factors respectively. Wind and solar do not run all the time, yet they still outproduced coal and nuclear in raw generation. The grid is now being driven by scale and deployment velocity, not by the efficiency of individual plants. This changes how you think about the infrastructure bet. The question is no longer whether renewables can displace hydrocarbons. The question is whether the grid can absorb them fast enough.
The Federal Energy Regulatory Commission's Energy Infrastructure Update, released on April 9, 2026 before the EIA data, projects that between now and the end of 2028, utilities and developers will add 86,126 MW of utility-scale solar capacity and 19,821 MW of wind. Natural gas gets only 8,154 MW of new capacity. Coal loses 40,828 MW. That pipeline, if it holds, moves renewables from 33.0% of installed utility-scale capacity at the end of 2025 to 38.8% by the end of 2028. The FERC numbers are conservative. Actual deployment in 2025 ran ahead of earlier forecasts, and the Q1 2026 growth rates suggest momentum is not slowing.
The real constraint is no longer generation. It is transmission, storage, and dispatch. A grid where wind and solar individually outproduce coal means intermittency is now a structural feature, not a problem to be managed at the margins. Every grid operator, every utility, every independent system operator is now forced to plan for a system where the grid does what the sun and wind allow, not what demand signals require. This is why battery storage capacity grew 8.5% in Q1 alone, storage is becoming the margin-setter on the grid, not the niche use case. This is why FERC is moving faster on transmission permitting and interconnection reform. The grid has crossed a threshold where the old operating model does not scale.
Watch three things. First, whether Q2 and Q3 2026 data sustain the coal decline, if coal stabilizes and natural gas gains, the inflection was Q1 noise, not structural. Second, whether actual solar and wind capacity additions in 2026 hit the FERC projection of 86,126 MW and 19,821 MW or exceed them. Third, whether battery storage capacity additions maintain the 8.5% quarterly growth rate or accelerate. If all three track or exceed forecast, renewables move to plurality on the grid, not majority, but unmistakably the leading source, by end-2026.